Step 8 to making a current state value stream map is to capture data. Before you start reading this article, be sure to check out the first, second, third, fourth, fifth, sixth and seventh steps. Here’s a recap of the steps that I recommend you to follow initially while making your CSVSM:
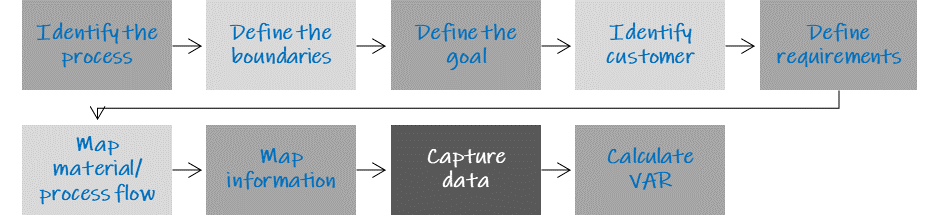
Figure 1 – Steps to construct a CSVSM
Step 8: Capture Data
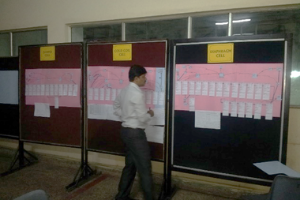
The best way to capture data is to trace the work and information flow on a real-time basis between the ‘starting point to ending point’. These are the boundaries that you have already defined in the previous steps. Find data boxes for each material flow step (the same applies to information flow).
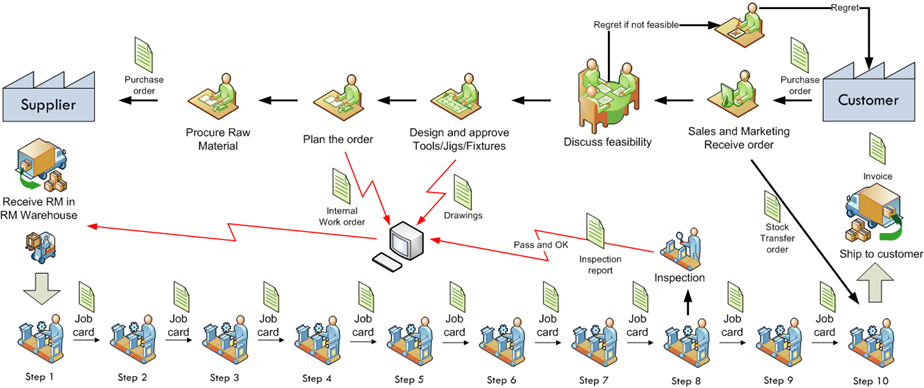
Figure 2 – A VSM with data boxes
Commonly Used Data Collection Techniques
- Time and motion study
- Work-study
- Use historical information from mailboxes – usually from services
- Utilize system time stamps
- Use experience (least preferred)
- Use interview (least preferred)
- Utilize PLC data
- Use data from job cards
- Data from route cards
What should Data Collection Comprise?
Look at every process step of data collection from 3 perspectives:
- Time: Such as cycle time, and changeover time.
- Quality: For instance, defective % and accuracy %.
- Utilization: Such as productivity, efficiency, OEE%.

Regarding data collection, I usually look for more than these when I visit the floor. As a consultant, I don’t get much time to spend in a company. Therefore, I try to make the most of my time during shop floor visits. Additionally, I look at other information at every step while mapping a value stream.
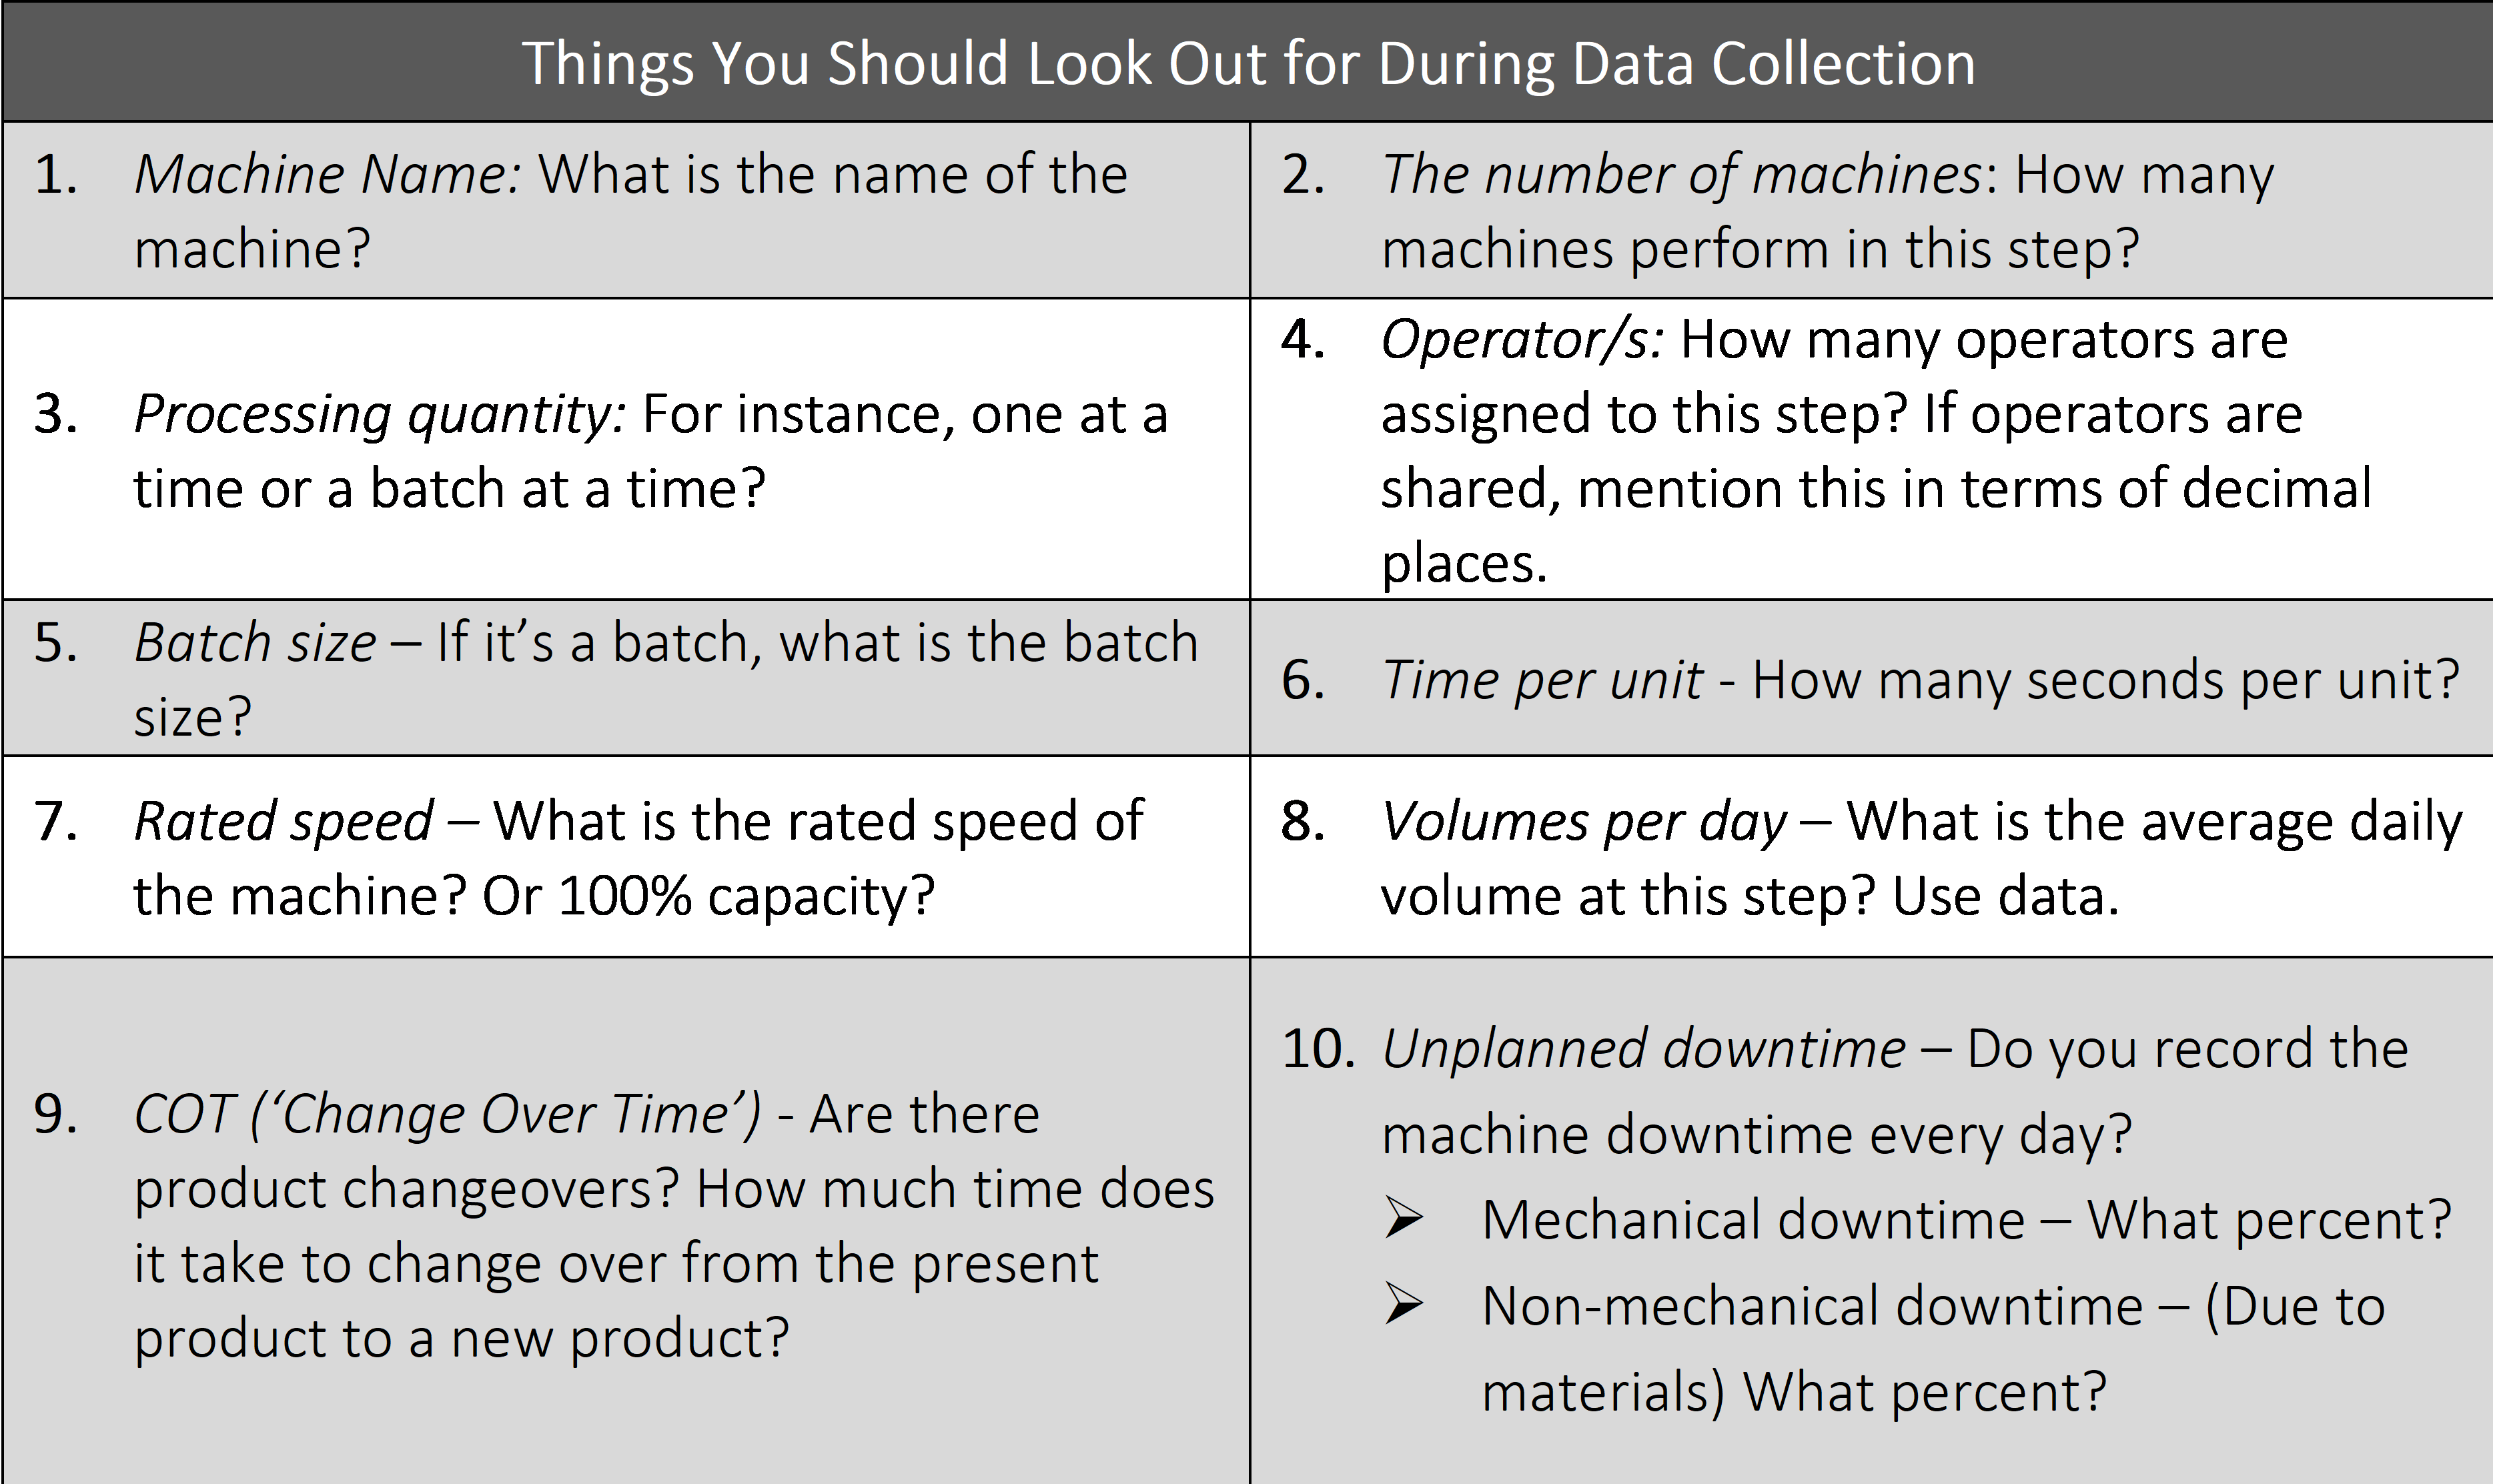
The table below shows some other things you should search for during data collection. However, keep in mind that looking for all of them is not mandatory.
Filling the Data Boxes
- Fill in the relevant data for the manufacturing/production steps, and service flow steps.
- Data should be filled:
- In the box below the material flow steps
- Between the boxes – such as inventory levels, waiting time, queue time, jobs waiting
- Information flow between two steps – Emails, job cards
- On the supplier and customer side – Frequency and quantity of each shipment from suppliers to customers.
- If needed data is unavailable, plan and collect necessary data.
- To collect the data, prefer to walk the process by following a batch or a defined unit of work. Use a stopwatch and record the cycle time at the process. If the ‘throughput time’ is longer, carry out your study in phases or use historical information. If time is a constraint, the last resorts are to use experience and interview.
- Find below an example of a data box for manufacturing and services.
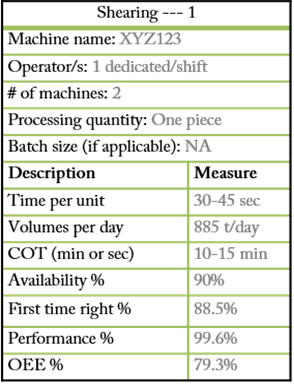
A data box in manufacturing
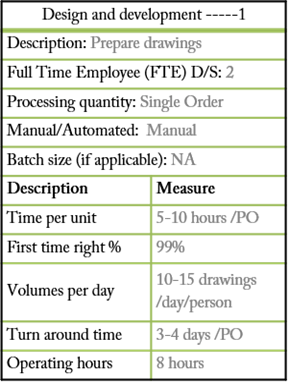
A data box in services
Most commonly used terms in data boxes (Non-manufacturing):
- Description: Name of the process step.
- Full-time employee (FTE): How many people carry this step out?
- Processing quantity: How many are done at a time?
- Manual/ Automated: Is the step manual or automated?
- Time per unit or cycle time – How much time does it take to finish one unit? Here, define a ‘unit’. A unit could be one purchase order or batch of 50 purchase indents.
- Capture the cycle time using a stopwatch or system timestamp.
- Ensure the cycle time represents the ‘start to finish’ time of the step, without any interruptions. This will help you gauge 100% capacity at the step.
- First time right %: What is the defective % here?
- Volumes per day: On average, how many transactions are carried out per day in this step?
- Turnaround time: The time difference between start to finish in this step. It can be the same as the cycle time, or there can be a difference of several hours or days depending on the nature of the process.
Click here to read the last step to making your current state value stream map – i.e., calculating the VAR!